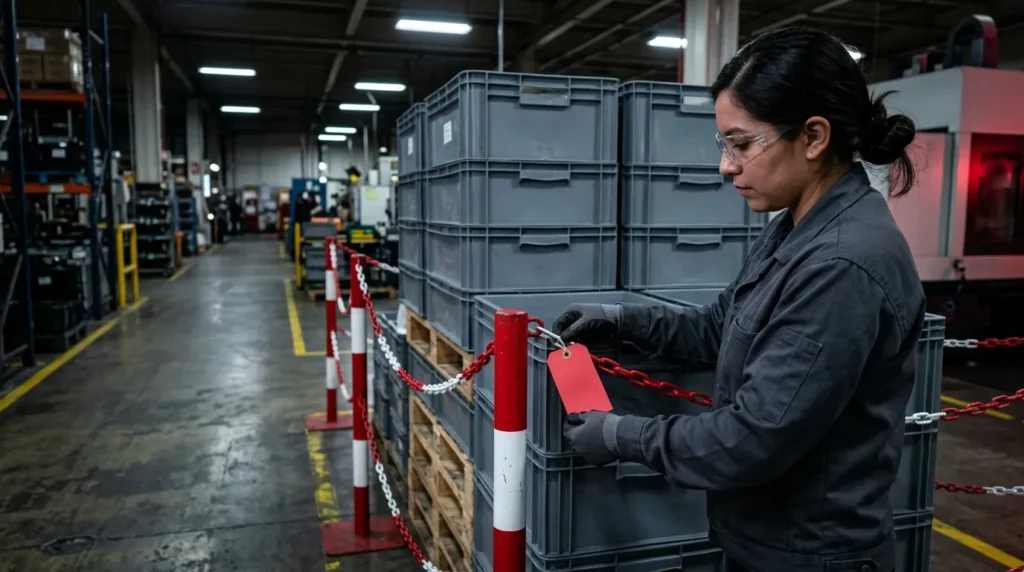
When a defect arises, the pressure is to resolve it immediately. But “resolving it” can mean four different things, with different goals, timelines, and responsibilities. Confusing them, or skipping the order of things, is the most common way for an internal problem to turn into a customer complaint.
Four Responses to a Defect. The Order Matters
The 8D methodology, in its version in the AIAG CQI-20 manual, orders the response in a sequence: first, what has already been seen is corrected; then, everything suspicious is contained; then, the cause is sought; then, the correction is made and the preventive action is taken; then, the prevention takes weeks.
| Response | What It Is | Objective | Focuses on | Example |
|---|---|---|---|---|
| Correction | Fix the part or lot that has already been detected | That what was detected complies today | The Symptom | Rework or scrap out-of-specification parts |
| Containment (D3) | Isolate all suspect material while the investigation is underway | That no bad part reaches the customer | Customer Plant, Transit, and Warehouse | Lot blocking, 100% sorting with a limit sample, and labeling of certified material |
| Corrective action (D4–D6) | Eliminate the root cause of the nonconformance | That the same defect does not recur | The root cause, verified with data | Adjust the machine program and update the work instruction |
| Preventive action (D7) | Eliminate potential causes before they occur | That it does not occur in similar processes or lines | The Risk: FMEA and Lessons Learned | Poka-yoke on the tooling and extending the change to twin lines |
The correction fixes what has already been seen. Containment protects the customer while the cause is sought. Skipping that step, that is, fixing the found parts and assuming they were all of them, is how an internal defect ends up on the customer’s end. In ISO 9001:2015, preventive action ceased to be a separate requirement and is addressed as risk-based thinking (clause 6.1).
If the Problem Persists, the Customer Escalates
When self-containment fails, the client takes control of the evidence in stages, each more costly than the previous one:
- Normal. The process’s own controls.
- CS1. Redundant inspection performed by the supplier’s own personnel.
- CS2. Redundant inspection performed by a third party approved by the customer.
- New business retained. The supplier receives no new programs until the issue is resolved.
The entry and exit criteria are defined by each client in their specific requirements. We explain in detail the difference between the levels and how to get out of them. CS1 and CS2: When the Customer Stops Accepting Your Evidence.
There is a different case that should not be confused: the GP12. It is not a punishment for a problem, but a preventive control of early production, with an additional station at the end of the line during launch. In all three cases the supplier pays; in GP12 the customer sets the start period and targets from the beginning.
Well-Calculated Metrics
None of the previous decisions is better than the numbers that support them. Four pairs of metrics are often confused on the ground.
PPM and DPMO are not the same thing
The PPM (defective parts per million) counts parts: defective among total, per million. With 12 defective parts in 48,000, the PPM is 250. The DPMO (defects per million opportunities) counts defects: defects per opportunity, per million. With 30 defects in 5,000 parts that have 4 opportunities each, the DPMO is 1,500. A part can have several defects; that’s why one number does not replace the other.
FPY and RTY: Rework Is Not Free
The FPY (first pass yield) is the proportion of good parts without rework: if out of 1,000 parts 940 are good on the first pass and 60 require rework rework, the FPY is 94%. A reworked part does not count as good the first time. The RTY (accumulated yield) multiplies the FPY of each stage: three stages with 98%, 95% and 97% give an RTY of 90.3%. Three good stages separately form an almost regular process.
Escape Rate: What Your Customer Does See
The escape rate divides the defects that reached the customer among the total number of defects. If 57 were detected in the plant and 3 reached the customer, the rate is 5% (3 of 60). It measures how well your detection fails, not your process, and is the number your customer uses to decide whether to scale up.
Cpk: Real Capability, Not Theoretical
The Cpk compares the distance from the average to each limit against three standard deviations, and chooses the lowest one. With limits of 9.80 and 10.20, average of 10.05 and deviation of 0.04, the Cpk is 1.25, although the Cp gives 1.67: the process is capable, but it is skewed. According to the AIAG SPC manual, a Cpk of 1.33 or higher is the usual requirement in production, and in preliminary PPAP studies a 1.67 index is usually requested.
Where a Third Party Comes In
At RIDYS Group we work on the containment: lot blocking, 100% sorting against a limit sample, labeling of certified material, and records by lot and shift, at your plant, in transit, or at your customer’s warehouse. We also run GP12 stations and redundant CS1 and CS2 inspection, and we deliver the data your team uses to calculate these metrics without estimating them.
About our scope: Correction, containment, and data are our domain; the root cause, corrective and preventive action are the responsibility of your engineering team. We work against the criteria you or your client define and report what we find without editing it.
Do You Have an Open Defect and Material at Risk? Tell us the part, the defect, and where the material is and we’ll respond with a containment plan.