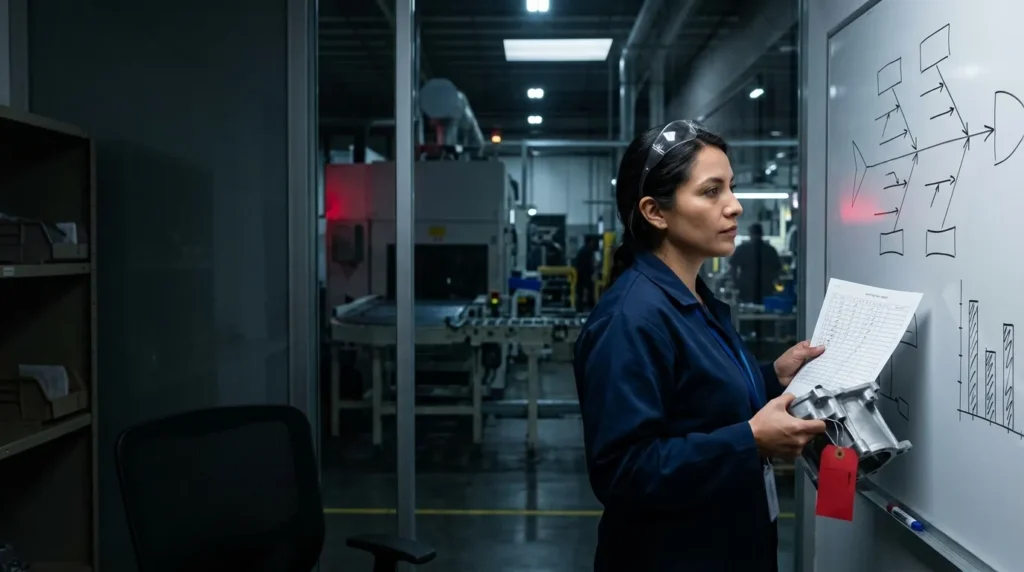
Eight disciplines, five why’s, an Ishikawa diagram with six branches and a Pareto chart. Every automotive quality engineer is trained in those tools, and the templates are identical from one plant to another. Still, the 8D report that returns rejected almost never is rejected because of using the wrong method. It is rejected because nothing under it can be verified.
First, a Limit
This article is not a guide to developing an 8D. Root cause analysis and corrective action belong to the supplier’s engineering team: they own the process, the product, and the decision. What follows is about something that comes before all that: the data on which the analysis is based, and what happens to the conclusion when those data are weaker than the method.
Between D1 and D8, almost all disciplines are an assertion that has to rest on something measurable: describing the problem, containing it, finding the cause, verifying the action, and preventing recurrence. Only team training and closing are administrative tasks.
An Ishikawa Full of Memories
An Ishikawa diagram is a way of organizing what is known. When no one stratified the defects, it becomes a way of organizing what people believe in the room, and the branch with the most sticky notes is the one who spoke the loudest. The diagram looks the same in both cases, and that is what makes it dangerous.
The same applies to the five why questions. Each step should be based on something observed. Without evidence at each level, the exercise becomes a coherent narrative that is impossible to refute, one that reaches its intended conclusion regardless of who holds the pen.
A Pareto Inherits Its Classification
A Pareto requires that the same defect be named the same way in all shifts, by all inspectors, throughout the period. If the night shift wrote “scratch” and the day shift wrote “surface mark,” the graph is not a ranking of priorities: it is an effect of vocabulary. Same data, same month, and an opposite corrective action, just because one category was defined broader than the other.
That is why a defect code has to carry four things:
| Field | Example |
|---|---|
| Failure mode | Porosity (not “scrap”) |
| Location | Zone B, seal face, cavity 3 |
| Severity | Over 1.0 mm, affects function |
| Where it was found | Final inspection, second shift |
“Scrap,” “NOK,” and “rework” are dispositions, not failure modes. A record that only stores dispositions can count parts but cannot locate a cause, because two parts with the same disposition may have nothing physically in common. It is the most common data defect we find when a containment starts: months of history that cannot be stratified.
Two Inspectors, One Part, Two Codes
If two people classify the same part differently, the Pareto is noise before it is even charted, and the error is invisible because the tools keep working. Classification is also a measurement system, and it can be evaluated as one: take about thirty parts covering all failure modes, including borderline cases; each inspector classifies them blind twice, on different days; and calculate each inspector’s agreement with themselves and between inspectors. If agreement falls below about 90%, the limit samples must be corrected before trusting any chart.
The Cause Is Not in the Total, It Is in the Breakdown
A defect rate is an average, and averages hide exactly the structure that identifies a cause: the lot, shift, cavity, tool, machine, operator, or supplier. A defect that looks even across the total may be concentrated in a single cavity on shift C. Those stratifications are only possible if they were recorded from day one. If the containment record only has date and quantity, every useful breakdown is lost forever.
The Fifth Why Is Usually Written, Not Found
Once written, the last why no longer becomes a hypothesis. It becomes the corrective action, the retraining, the poka-yoke, and the request for investment. An unverified sentence becomes a budget without anyone noticing. The test is simple: for every why, ask what record proves it. If the chain stops at the third level, everything that follows is inference. An 8D that says “verified up to level 3; levels 4 and 5 pending data collection” is a more solid document than one that says five things without being able to support them.
Two Root Causes: Why It Was Made and Why It Escaped
A complete root cause answers two questions, not one: why the defect occurred and why it was not detected. The point of escape is a separate investigation, with its own evidence, and it is almost always the half that matters most to the customer, because it tells them whether the next one will also arrive.
A part reaches the customer after passing every control that existed: control at the source, containment, and final inspection. Each gate failed in one of three ways: it did not exist, it was poorly specified, or it was not effective. The three have nothing in common. If the gate did not exist, a control is missing from the plan. If it was poorly specified, it checked a characteristic the defect does not affect, for example sorting by diameter that would never catch a position error. If it was not effective, it is a detection problem, and detection can be measured. “Inspection failure” lumps all three into a single phrase that allows no corrective action.
Visual inspection without support does not operate at 100%, and its effectiveness decreases just as defects become less common. What makes it auditable is measuring it: station analysis, parts sown at a defined frequency with expected response, actually independent passes when two are used, and the detection rate reported per shift alongside the inspected parts.
A cause is confirmed when it can be turned on and off
Ideally, the cause is confirmed when the defect can be reproduced and then eliminated with the identified variable. Until that happens, what exists is a correlation with a convincing narrative. Verification requires a baseline before the change, measured with the same definition of defect, the same sample size, the same level of inspection, and the same population. If the “before” is an estimate from a claim and the “after” is a week of reinforced inspection, nothing has been verified: two variables were changed and the desired result was reported. That is the step that is most often overlooked, because the baseline was needed before anyone knew that it would be needed.
The Minimum Record for a Containment
Seven fields, captured from the first shift, turn a containment into the 8D’s most valuable data source:
| Field | Why it is there |
|---|---|
| Lot and Date | Traceability to Process Conditions |
| Shift | Operator Population and Fatigue |
| Quantity Inspected | The Denominator: Without It, There Is No Rate |
| Quantity per Failure Mode | Pareto, stratification, and trend |
| Location | Ties the defect to a cavity or station |
| Scope | What was inspected and what was not |
| Criteria Review | Which standard was in effect |
Collected from the first shift, they make every chart in this article possible. Added later, they reconstruct very little. The sorting is the only point in the flow where every part is seen, judged, and recorded: it is a quality wall, but it is also the highest-resolution measuring instrument in the plant, and almost always the one no one specified.
Seven Questions Before Closing Your Next 8D
- Was the failure mode classification defined before containment started?
- Do the codes include failure mode, location, severity, and detection point?
- Has inspector classification agreement ever been measured?
- Is each “why” tied to a specific record?
- Is there a root cause for detection, or only for occurrence?
- Which gate failed: it did not exist, was poorly specified, or was not effective?
- Is there a baseline to verify the correction?
What We Put Under Your Analysis
At RIDYS Group we perform inspection, sorting, rework, and containment, and we produce the records that come out of that work. From day one, we agree with your engineer on a fixed list of failure modes with limit samples, so every shift names the same defect the same way. We deliver daily quantities inspected and defects by failure mode, lot, shift, and date. We document what the criterion said, what was sampled, and who inspected — the evidence for the half of the analysis your customer reads most closely. And we keep the measurement constant throughout the containment, so your effectiveness check compares like with like. If the containment has already escalated to CS1 or CS2, that record is also the basis of your exit file.
About our scope: The root cause analysis, corrective action, and 8D are the responsibility of your engineering team; we do not develop or sign off on them. What we provide is the evidence that goes below, generated against the criteria you define and reported without editing.
Do you have an open 8D? Review your D2 and ask where the numbers came from. If you’d like, tell us the part and the failure mode and we’ll tell you what a containment would need to record for that analysis to be defensible.