

1. Service Background
The company GRUPO RIDYS DE MÉXICO, S.A. DE C.V. provides dimensional and visual inspection for industrial customers, mainly in the automotive and manufacturing sectors. Its services are used as Objective evidence of conformity, Both for product release and to comply with contractual and regulatory requirements. In response to customer requirements and internal audits, the need to demonstrate that the inspection process is stable, repeatable, and statistically controlled, minimizing reliance on the inspector’s subjective judgment and reducing the risk of incorrect acceptance or rejection decisions.
2. Inspection Process Description
In a service context, SPC is not used to control the customer’s production process, but for control the consistency of the inspection process, ensuring that:
- Measurements are stable over time
- There is no bias between inspectors or shifts
- Release decisions are objective and defensible
3. SPC APPROACH APPLIED TO THE INSPECTION SERVICE
The following were defined: rational subgroups of 5 consecutive measurements taken by the same inspector, under the same measurement conditions. 25 subgroups were collected during the service delivery.
X Chart (Inspection Averages)
Observed results:
- All means are within the control limits
- No out-of-control points are detected
- No trends, runs, or non-random patterns are identified
Interpretation applied to inspection:
The measurement and inspection process of GRUPO RIDYS DE MÉXICO, S.A. DE C.V. it is stable, which indicates that inspectors apply the measurement method consistently and without systematic bias.
4. Building the X–R Charts
The following were defined: rational subgroups of 5 consecutive measurements taken by the same inspector, under the same measurement conditions. 25 subgroups were collected during the service delivery.
X Chart (Inspection Averages)
Observed results:
- All means are within the control limits
- No out-of-control points are detected
- No trends, runs, or non-random patterns are identified
Interpretation applied to inspection:
The measurement and inspection process of GRUPO RIDYS DE MÉXICO, S.A. DE C.V. it is stable, which indicates that inspectors apply the measurement method consistently and without systematic bias.
R Chart (Inspection Variation)
Observed results:
- Ranges remain within the control limits
- The spread is uniform over time
Interpretation applied to inspection:
The variability of the inspection process is controlled, confirming that the measurement system and the inspector's technique do not introduce any significant additional variation.
5. CONCLUSION OF THE SERVICE STATISTICAL CONTROL
Based on the X–R charts:
The inspection process operated by GRUPO RIDYS DE MÉXICO, S.A. DE C.V. is under statistical control, fulfilling the requirements for reliable decision-making regarding acceptance and rejection. No special causes attributable to the operator, instrument or method are identified.
6. INSPECTION PROCESS CAPABILITY STUDY
Once statistical control was confirmed, the inspection process capability, considering the spread of the measurements relative to the customer specifications.
Indices obtained:
- Cp = 1.83
- Cpk = 1.82
7. INTERPRETATION OF THE CAPABILITY STUDY (IN SERVICES)
- The inspection process includes sufficient capability to detect real deviations in the inspected product.
- The closeness between Cp and Cpk indicates that the inspection process is correctly centered, without bias toward the limits.
The risk of false accepts or false rejects is low.
8. ADDED VALUE OF SPC IN INSPECTION SERVICES
Implementing SPC allows GRUPO RIDYS DE MÉXICO, S.A. DE C.V.:
- Technically Back Your Inspection Reports
- Reduce Contractual and Legal Risk
- Demonstrate Technical Competence to Customers and Auditors
- Standardize Inspector Performance
- Increase the Reliability of the Service Provided
9. Final Conclusion
The application of SPC to inspection services performed by GRUPO RIDYS DE MEXICO SA DE CV confirms that the inspection processes applicable to dimensional projects are stable, repeatable, and reliable, turning inspection from an operational activity into a technically controlled process, aligned with quality principles, continuous improvement, and regulatory compliance.
SPC STUDY CHARTS

Inspection Service – GRUPO RIDYS DE MÉXICO, S.A. DE C.V.
1. X Chart (Inspection Averages)
Chart structure:
- X-axis: Inspection subgroups (1 to 25)
- Y-axis: Average of the 5 measurements per subgroup (mm)
- Center line (CL): Grand average of the means
- Upper control limit (UCL): CL + A2·R
- Lower control limit (LCL): CL − A2·R
Expected interpretation:
- All means within UCL and LCL
- Random distribution around the center line
- No trends, runs, or systematic patterns
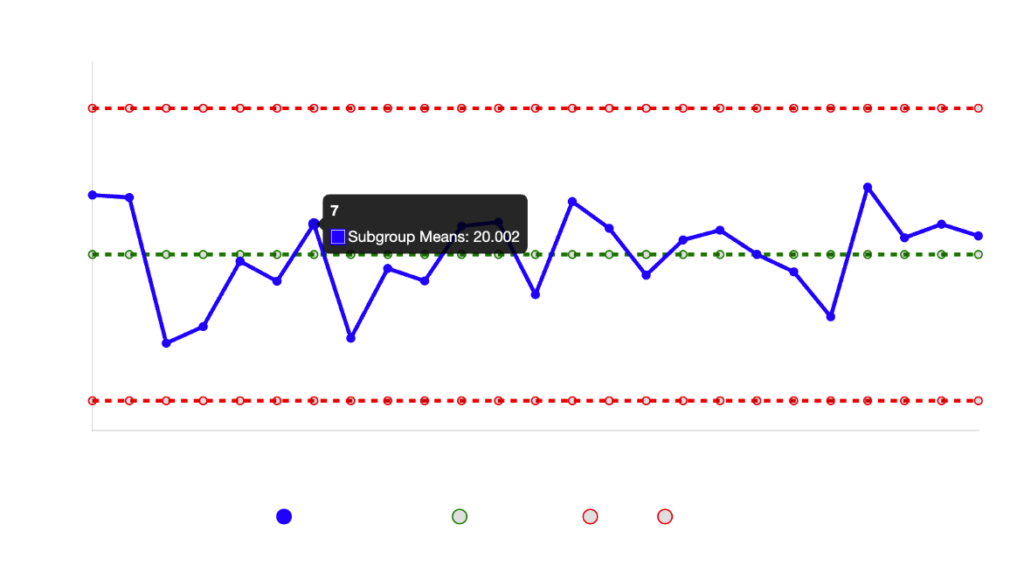
Technical conclusion: The measurement and inspection process is stable, with no inspector bias and no shift in the inspection method.
2. R Chart (Inspection Ranges)
Chart structure:
- X-axis: Subgroups
- Y-axis: Range (maximum – minimum) of each subgroup
- Center line (CL): R
- Upper control limit (UCL): D4·R
- Lower control limit (LCL): D3·R (≈ 0)
Expected interpretation:
- Consistent Ranges Within the Limits
- No Isolated Variation Spikes
- Homogeneous dispersion among subgroups
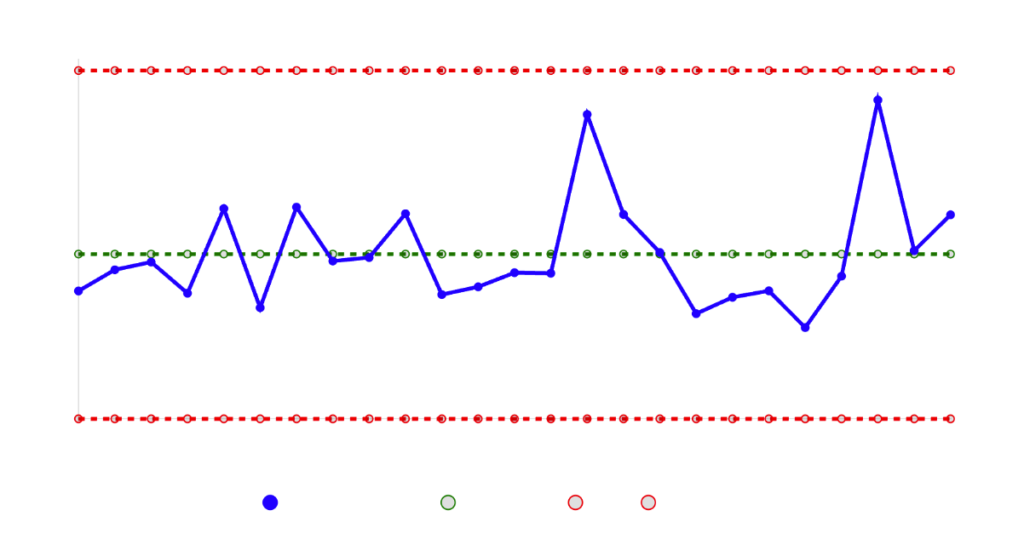
Technical conclusion: The variability introduced by the inspection system is consistent and controlled. The X–R charts show that the Inspection Service provided by GRUPO RIDYS DE MÉXICO, S.A. DE C.V. operates under statistical control, guaranteeing acceptance or rejection decisions objective, repeatable, and defensible.
3. Process Capability Chart (Histogram)
To illustrate the capability study, a histogram of the measurements is included with the normal curve overlaid and the specification limits (LSL and USL). It shows that the process is centered and capable, with most data within specification.
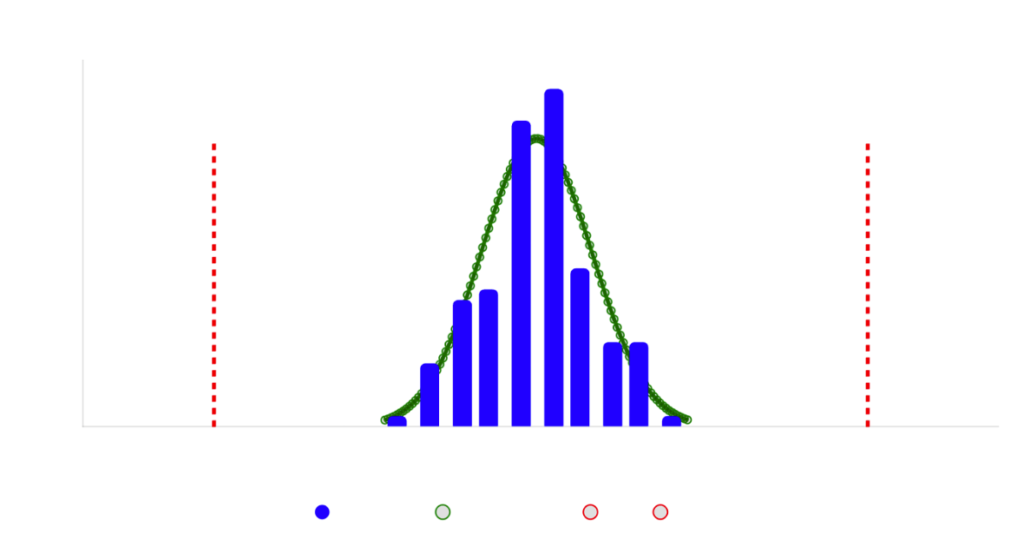
General Conclusion: These charts confirm the conclusions of the case: the inspection process is stable and capable, with no special causes of variation.
The X Chart demonstrates that the measurements are within the control limits, with no outliers or trends, indicating stability in the inspection process.
The R Chart It confirms that the ranges remain controlled and uniform, reflecting low and consistent variability in the measurement techniques.
The Histogram The capacity display shows that most of the data falls within the specifications (LSL=19.95 mm, USL=20.05 mm), with a centered normal distribution.
Cp = 1.83 and Cpk = 1.82 indicate high process capability, with low risk of false accepts or rejects.